

The published study compared a control with 1% and 2% matcha powder. Under that study's own test conditions, mix viscosity rose sharply in the 2% sample, instrumental lightness fell as matcha increased, first-drip time became shorter, and overall acceptability ranked control > 1% > 2%. These are study-specific results-not commercial specifications or universal dosage advice.
There is no evidence-based universal percentage that can be called "too much" for every ice cream. A 2017 study tested a control formulation and ice creams containing 1% and 2% green tea powder (matcha). In that specific formulation, increasing matcha was associated with substantial changes in mix viscosity and instrumental color; the 2% sample had the highest reported viscosity, while the panel's overall-acceptability ranking favored the control, followed by the 1% sample and then the 2% sample. Those findings make the paper a useful formulation case study, not a ready-to-copy commercial recipe. [1]
For an R&D team, the practical question is not simply "How much matcha gives the strongest green?" It is "At what inclusion level does this powder, in this base and process, meet the visual, flavor, processing, melt, and consumer-acceptance targets together?" The answer must be established in the intended product system.
1. What Did the Published Matcha Ice-Cream Study Actually Test?
The paper by Yüksel, Yüksel, and Şat evaluated ice cream made with green tea powder at different concentrations and measured physicochemical characteristics, color, organic acids, minerals, and sensory properties. The reported matcha groups contained 1% and 2% powder; a control group contained no added matcha. The authors describe manufacturing the experimental samples in duplicate. The sensory panel consisted of 50 untrained participants, and overall acceptability was assessed alongside appearance/color, texture, melting in the mouth, flavor, and sweetness. [1]
The experimental recipe is important because the powder was not evaluated in isolation. The base included cow's milk, cream, skim milk powder, sugar, sahlep as a stabilizer, and mono- and diglycerides as an emulsifier. The paper reports the mix composition as 5% fat, 4.7% skim milk powder, 18% sugar, 0.6% sahlep, and 0.2% emulsifier. Those are the researchers' formulation details; they are not a recommended standard for commercial ice cream or a specification for any supplier's matcha. [1]
The processing sequence also defines the meaning of the results. The study reports heating the mix to 85°C for 25 seconds, rapid cooling to about 4°C, maturation for 24 hours at about 4°C, freezing in an ice-cream machine, hardening at −22°C for 24 hours, and storage at −20°C before analysis. A customer's production line may use different ingredients, equipment, shear history, freezing profile, packaging, and storage conditions. Accordingly, the paper's conditions are methodological context-not a plant-scale process recommendation. [1]
| What the study specifies | Reported details | How a formulator should interpret it |
|---|---|---|
| Matcha inclusion groups | Control, 1%, 2% | Test points in one paper, not a universal dosage range. |
| Base ingredients | Milk, cream, skim milk powder, sugar, sahlep, mono- and diglycerides | Changes reflect the powder in this specific dairy matrix. |
| Mix heat treatment and maturation | 85°C for 25 seconds; about 4°C for 24 hours | Published experimental method; do not assume it transfers directly to a factory. |
| Panel | 50 untrained panelists | A sensory result from this study's panel, not market-wide consumer validation. |
2. How Did Matcha Inclusion Change the Measured Color?
In the 2017 study, instrumental lightness (L*) declined as the matcha level increased: the control measured 87.42, the 1% sample 71.09, and the 2% sample 67.35. The b* value increased from 13.21 in the control to 21.03 and 22.92 in the 1% and 2% samples, respectively. These measurements come from the paper's recipe and instrument method; they should not be turned into a supplier acceptance specification or an expected value for every matcha ice cream. [1]
A lower L* indicates a darker sample in the measured color space. A shift in b* is one component of color difference; it does not, by itself, quantify "greenness." Therefore, a buyer or formulator should not interpret a single L* or b* number as proof that a product is greener, more authentic, or higher quality. If green appearance is a launch criterion, define the finished product's color target using the team's chosen measurement protocol and evaluate it in the final matrix, under consistent sample preparation and measurement conditions.
The study supports a narrower conclusion: changing matcha inclusion changed the measured color of that ice cream. It does not establish a universal relationship between a supplier's powder color and the finished product, nor does it isolate all causes of the color shift. Powder color, particle distribution, the milk-and-sugar matrix, processing, and storage may matter in a specific product, but the cited study did not establish a general predictive equation for those factors. Commercial trials should record the powder lot and finished product's instrumental readings rather than assuming the paper's values will reproduce.
For sourcing discussions, request verifiable batch documentation for the actual ingredient under consideration, then conduct a side-by-side trial in the intended base. A powder that looks vivid in a dry sample is not automatically guaranteed to deliver a specific frozen-product shade. The value of the published color data is that it demonstrates a measurable formulation response-and warns teams to specify what they mean by "green" before choosing an inclusion target.

3. Why Did Mix Viscosity Rise While First-Drip Time Fell?
The paper reports mix viscosity values of 2,773 cP for the control, 3,062 cP for the 1% matcha sample, and 9,504 cP for the 2% sample. The viscosity measurement was performed at 4°C using a Brookfield viscometer with an RV spindle No. 2 at 50 rpm. Under the study's separate melting test, first-drip times were 545 seconds for the control, 510 seconds for the 1% sample, and 391 seconds for the 2% sample. The authors also report complete melting times of 3,039, 2,396, and 2,319 seconds, respectively. [1]
At first glance, the high viscosity of the 2% mix may seem inconsistent with its shorter first-drip time. It is not necessarily a contradiction: viscosity of the unfrozen mix and drip or melt behavior of the frozen product are different responses measured by different procedures. A higher viscosity reading in the mix does not alone prove that a hardened product will resist melting longer. In this study, the 2% sample had both the highest mix viscosity and the shortest first-drip time among the tested samples. That observation is a reason to measure both properties-not a basis for assuming one predicts the other. [1]
The methods matter when comparing values. For the drip/melt test, the paper describes a 25 g hardened ice-cream sample placed on a wire mesh above a beaker at approximately 20°C. A processor using a different sample mass, serving temperature, mesh, room temperature, overrun, hardening conditions, or endpoint definition may obtain different times. Results should only be compared when procedures are sufficiently aligned or the difference is clearly disclosed.
This is a practical formulation lesson: do not approve a powder solely because it increases mix viscosity, and do not use a single "melt resistance" number as a proxy for every eating-quality attribute. Record mix viscosity under a defined method, then evaluate the frozen product with actual serving conditions, sensory texture, first-drip behavior, and complete-melt endpoint. The published values are useful as a case study-not as targets for a customer's product.
| Response measured | Control | 1% matcha | 2% matcha | Test context |
|---|---|---|---|---|
| Mix viscosity | 2,773 cP | 3,062 cP | 9,504 cP | 4°C; Brookfield RV spindle No. 2; 50 rpm |
| First-drip time | 545 s | 510 s | 391 s | 25 g hardened sample; approximately 20°C test environment |
| Complete melting time | 3,039 s | 2,396 s | 2,319 s | Same study's melting procedure |
4. Does a Darker Matcha Ice Cream Automatically Win With Consumers?

The paper's reported overall-acceptability ranking was control first, followed by the 1% matcha sample and then the 2% sample. It does not mean that consumers universally prefer plain ice cream to matcha, or that a higher matcha level will always be disliked. It means that, in this study's recipe, panel, and evaluation conditions, the no-matcha sample ranked highest for overall acceptability. The study used 50 untrained panelists; it was not a consumer trial representing every geography, age group, price tier, or matcha dessert format. [1]
The result is commercially useful because it challenges a common product-development shortcut: optimizing for the strongest visible green or the largest ingredient declaration without confirming whether the resulting flavor and texture fit the intended audience. Matcha contributes color and characteristic tea flavor, while the dairy, sugar, fat, stabilizer, and emulsifier system shapes the overall eating experience. The research did not independently quantify a universal sensory threshold, so a brand should not infer one from the ranking alone.
A sound launch decision pairs instrumental and sensory evidence. Before a test, define the intended flavor profile, color direction, sweetness level, texture, and target consumer. During evaluation, use blind-coded samples and consistent serving conditions. Record whether panelists judge appearance, flavor, sweetness, texture, and overall liking separately; this helps identify whether a lower overall score comes from bitterness, color expectations, texture, or another attribute. Any internal panel result should be described as an internal trial, not as published evidence.
For a B2B buyer, the finding also suggests what to ask a supplier. Can the supplier provide a current specification and representative lot sample? Are color and sensory characteristics measured or documented for the actual batch? Is the ingredient being offered a whole-leaf powder or an extract? These are verification questions, not assumptions about a particular supplier. The final choice should be made on the product matrix and the buyer's evidence-not on a generic "premium grade" label.
5. How Can Formulators Use the Study Without Copying Its Recipe?
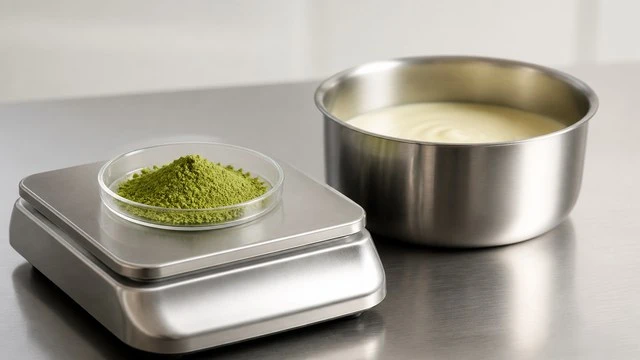
The published formulation can be used as a reference for endpoints worth measuring, not as a plug-in recipe. It tested a control, 1%, and 2% matcha in a specified dairy base, then reported color, mix viscosity, dripping/melting, composition, and sensory observations. A commercial team should first map its own constraints: dairy or plant-based base, sweetness target, fat/protein system, stabilizer and emulsifier choices, freezing equipment, packaging, serving temperature, target color, and expected sensory profile. The cited study does not supply validated settings for all those systems. [1]
A practical trial design begins with an untreated control using the intended production base. Select test levels based on the team's actual product brief, current supplier sample, and pilot capacity; the paper's 1% and 2% are study points that may be included as literature-referenced comparisons where suitable, not mandated commercial targets. Keep other ingredients and processing steps consistent within the trial so that the effect of matcha inclusion can be interpreted. If a process or ingredient must change, document the change and avoid attributing every difference to matcha alone.
Measure the attributes that correspond to the product promise. For color, define a consistent color-measurement method and record L*, a*, and b* rather than using an informal visual adjective as the sole acceptance rule. For processability, record mix viscosity with instrument, spindle, speed, temperature, and sample history. For the frozen product, record overrun and melting/dripping using a repeatable test. For eating quality, conduct a blind sensory evaluation under fixed serving conditions. These are recommended measurement practices for making a trial interpretable; they are not numeric product limits established by the cited paper.
The team should also preserve a clear evidence trail: powder identity and lot, supplier specification, inclusion basis, mixing order, hydration/dispersal method, heat treatment, maturation, freezing and hardening conditions, storage history, measurement protocols, and deviations. The paper illustrates why this matters: the reported viscosity is meaningful together with its method, and the reported sensory ranking is meaningful together with the panel and formulation context.
The decision gate should be explicit. Proceed only if the selected formula meets the team's documented color, processing, melt, flavor, and consumer-acceptance criteria in the intended system. If a sample does not meet them, adjust the powder, inclusion, base, or process through controlled trials. Do not label an untested operational suggestion as an industry standard, and do not claim that a formula is "stable," "commercially proven," or "shelf-life validated" without product-specific evidence.
| Trial record | What to document | Why it matters |
|---|---|---|
| Ingredient identity | Product form, supplier lot, available specification, and whether whole-leaf powder or extract | Prevents unlike ingredients or batches from being treated as equivalent. |
| Formulation basis | Matcha inclusion basis and full base composition | Makes comparison reproducible and clarifies what the percentage refers to. |
| Processing history | Mixing, heating, cooling/maturation, freezing, hardening, and storage steps | Separates ingredient effects from process differences. |
| Physical measurements | Color method, viscosity method, overrun, and defined drip/melt endpoints | Allows like-for-like comparison between trial samples. |
| Sensory assessment | Panel type, serving conditions, attributes, sample coding, and results | Avoids presenting a small internal test as general consumer preference. |
6. What Does Matcha Storage Research Tell Frozen-Dessert Buyers?
A 2020 study examined how storage temperature and time affected a particular matcha powder's color, phenolic and flavonoid measurements, catechins, caffeine, rutin, and antioxidant-assay results. The researchers stored samples under several temperature conditions, including 4°C, 25°C, 35°C, 45°C, and 80°C, and followed them over a period extending to two months. The paper reports an overall decline in several measured quality and bioactive indicators as temperature and storage time increased. [2]
This evidence is relevant to ingredient sourcing and storage planning because it shows that a powder's composition and visual quality can change during storage. It does not establish a universal storage limit for all matcha, nor does it determine the shelf life of ice cream made with matcha. The study's raw-material sample, packaging, and experimental storage conditions are not interchangeable with a finished frozen dessert's formulation, package, freezer temperature history, or distribution chain. The paper should not be used to infer a frozen dessert's best-before date.
For a commercial buyer, the appropriate next step is to check the supplier's handling instructions and retain lot-specific information. If finished-product color is a key selling attribute, evaluate ingredient and product samples under relevant storage conditions using a defined method. A finished-product shelf-life statement requires product-specific stability evidence and applicable food-safety validation; it cannot be created by converting raw-powder results into a date.
The same evidence discipline applies to comparisons between suppliers. A paper on one matcha powder does not prove that all powders respond identically. Product origin, processing, packaging, and batch composition can vary. Where those variables are not documented for the actual product being purchased, describe them as unknown and request the appropriate specification or test data rather than filling the gap with a generic number.
7. Frequently Asked Questions About Matcha Powder for Ice Cream
1. What matcha percentage should I use in commercial ice cream?
The cited study tested 1% and 2% matcha in its own recipe; it does not establish a universal commercial dosage. Choose trial levels according to the target flavor, color, base composition, processing, and sensory requirements, then verify them in the intended product. [1]
2. Did more matcha make the studied ice cream greener?
The paper reported lower L* and higher b* values as matcha increased. Those measurements show color changes in that formula, but L* and b* alone should not be treated as a universal "greenness" score or an ingredient quality grade. [1]
3. Does higher mix viscosity mean better melt resistance?
Not necessarily. In the paper, the 2% sample had the highest mix viscosity but a shorter first-drip time than the control under the study's test. Mix viscosity and frozen-product melt behavior are separate responses and should be measured separately. [1]
4. Did the study prove that consumers prefer lower-matcha ice cream?
It reported the overall-acceptability ranking control, then 1%, then 2%, based on 50 untrained panelists. That is evidence about this study-not a universal consumer preference. A brand should test its own target market and product. [1]
5. Can raw-matcha storage data define the ice cream's shelf life?
No. The cited storage paper examined matcha powder, not a finished frozen dessert. Use finished-product stability testing and applicable safety validation for any shelf-life conclusion. [2]
6. Does matcha powder always precipitate or destabilize dairy ice cream?
The reviewed evidence does not support that blanket claim. Tea polyphenols can interact with milk proteins, but the reported effects depend on the system and the literature includes differing results. The 2017 ice-cream paper measured specific product properties; it does not establish that every matcha dairy formulation will destabilize. [1][3]
8. A Practical Sourcing and Formulation Decision
For procurement and formulation teams, the most defensible decision is to compare candidate powders in the intended base rather than choose by an unsupported grade name or one isolated specification. Start by confirming what the ingredient is, obtaining the current product documentation, and agreeing which finished-product attributes matter: color, tea flavor, mix handling, frozen texture, drip/melt behavior, and sensory acceptance. Then conduct a controlled comparison with the actual process and record the methods used.
The 2017 paper is valuable because it gives real test conditions and outcomes: the tested matcha levels, the dairy base, the mix-viscosity method, the melt test, color readings, and a sensory ranking. It is equally valuable for what it does not provide. It does not set a universal inclusion rate, universal color specification, target viscosity, or finished-product shelf-life limit. The 2020 raw-powder storage study adds evidence that storage conditions affect measured matcha properties, but it is not a frozen-dessert shelf-life study. [1][2]
A supplier discussion can therefore be specific without overstating the evidence. Ask for a representative sample and the product's applicable specification and batch documentation. Where a formulation target depends on a value not included in public literature, obtain the supplier's actual data or measure it during the trial. Do not attribute company-specific performance, certifications, batch figures, or process capabilities without records that support those statements.
This approach turns a broad "matcha ice cream grade" conversation into an auditable sourcing decision: define the finished product, compare documented lots, measure the attributes that matter, and validate the selected formula in its real process. If a frozen-dessert team is evaluating bulk matcha powder, Haoze Bio can provide available technical specifications, COA documentation, and laboratory samples for formulation evaluation. Specific grade suitability and outcomes should be confirmed with the actual sample and application test.
📩 haozebio2014@gmail.com
9. References and Evidence Boundaries
The values reported in this article are tied to the cited studies and their stated methods. They are not presented as product specifications, regulatory limits, company test results, or guaranteed commercial outcomes. Sensory, color, viscosity, melting, and storage conclusions should be interpreted only within the scope of the source study unless independently validated for the target product.
- Yüksel, A. K., Yüksel, M. İ., & Şat, İ. G. (2017). "Determination of Certain Physicochemical Characteristics and Sensory Properties of Green Tea Powder (Matcha) Added Ice Creams and Detection of Their Organic Acid and Mineral Contents." GIDA, 42(2), 116–126. DOI: 10.15237/gida.GD16072. Full text: https://dergipark.org.tr/en/download/article-file/272298
- Kim, J. M., et al. (2020). "Effect of storage temperature on the antioxidant activity and catechins stability of Matcha (Camellia sinensis)." Food Science and Biotechnology, 29(9), 1261–1271. DOI: 10.1007/s10068-020-00772-0. Full text: https://pmc.ncbi.nlm.nih.gov/articles/PMC7406592/
- Piyasena, N. P. P., et al. (2025). "Milk in tea: exploring the chemistry and biological activities." Food Science and Biotechnology, 34(12), 2707–2723. DOI: 10.1007/s10068-025-01841-y. Full text: https://pmc.ncbi.nlm.nih.gov/articles/PMC12240890/